
Get in touch
Contact us to see how we can help your business today.
According to Harvard Business, more than half of Americans rely on their gut to decide what to believe, even when they are confronted with evidence that speaks to the contrary. We’ve seen a lot of this in our personal and political worlds lately, and when it occurs in business, it can be devastating.

According to Harvard Business, more than half of Americans "rely on their gut" to decide what to believe, even when they are confronted with evidence that speaks to the contrary. We’ve seen a lot of this in our personal and political worlds lately, and when it occurs in business, it can be devastating.
Here’s why.
Data – the hard facts of numbers – eliminates supposition.
Unfortunately, more times than not, the data is disorganized, messy, and too noisy to arrive at a meaningful conclusion.
For as prevalent as the role of data has become in our personal and professional decision-making processes, it’s amazing to me how intimidating working with data can still be.
Part of this is because data is often disjointed and hard to manage. For example, I’m surprised at the number of times I ask a client to send us basic stats about their key accounts – and they can’t do it! It sometimes takes weeks to pull together. Names and contact info must come from a CRM, revenue has to come from an invoicing system, COGS has to come from accounting software. Then it all has to be manually merged together – a time-consuming, mind-numbing, and error-prone process.
Another reason data can be intimidating is that often teams don’t know how to analyze it. Opening an excel workbook with dozens of columns and thousands of rows can be more paralyzing than sitting down to do your own taxes. And trying to comb through hundreds of pages of interview transcripts? Many clients would rather get a root canal.
To make things more difficult, the truth is that even the most left-brain dominant among us are vulnerable to cognitive biases. There are hundreds of documented barriers and systemic patterns that stand in our way of objectively analyzing data.
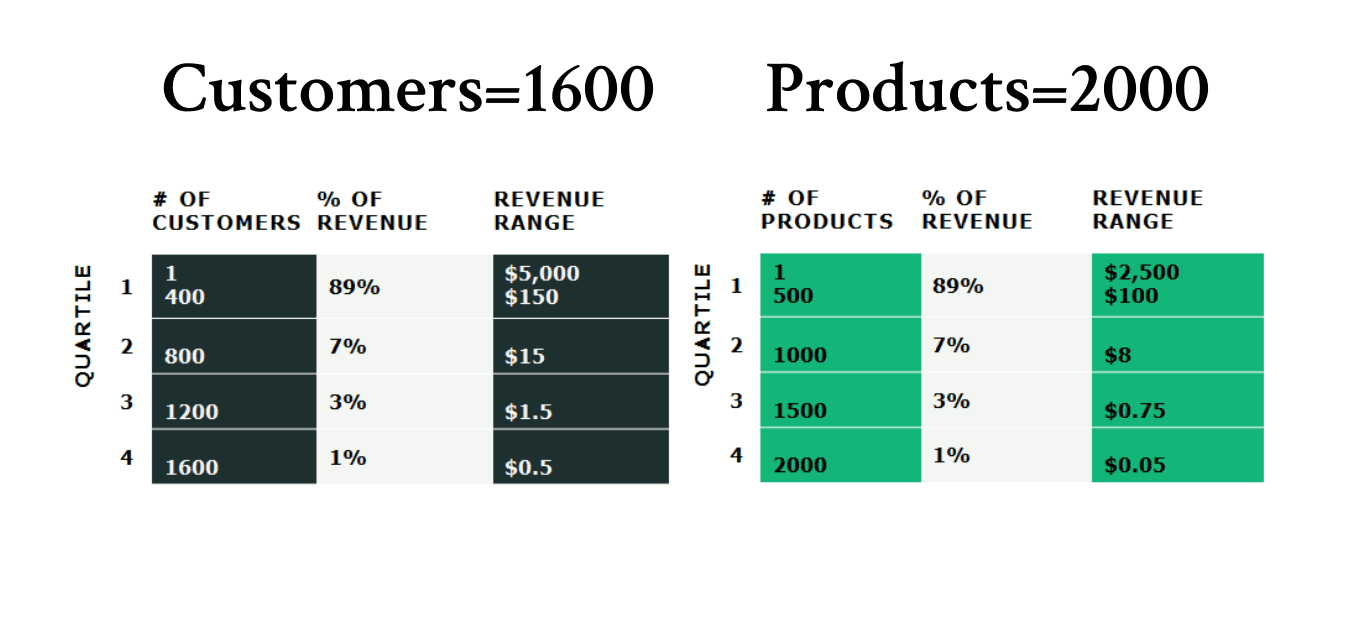
Performing a quartile analysis is a painless exercise that is always eye-opening. Take the revenue of every customer you have had in the last 12 months – from the highest revenue producer to the lowest – yes, even those customers with negative balances.
Now, divide them into equal quarters. I GUARANTEE that the top 25% of your customers are driving 89% (or more) of your revenue, followed by the next quarter at 7%, the third at 3% and the bottom quarter at 1%.
Why do you care? Because the bottom half of all your customers are only 4% of your revenue. These “4-percenters” will always use appreciably more of your resources (both human and economic) to solve seemingly small and non-productive problems – all for a measly 4% of your income. That is a problem!
Your products (or services) will follow a similar breakout. Typically, the bottom 50% of products generate less than 3% of revenues! We usually see that these products produce most of the manufacturing changeovers and challenges.
A little more difficult to analyze, but a quadrant analysis is a critical component of understanding your data. The quads help you take into consideration the relationship between products and customers. Companies must understand which products are strategic (those that support our top customers) and those that are not.
The quads are the four corner intersections of customers and products. Who buys what?
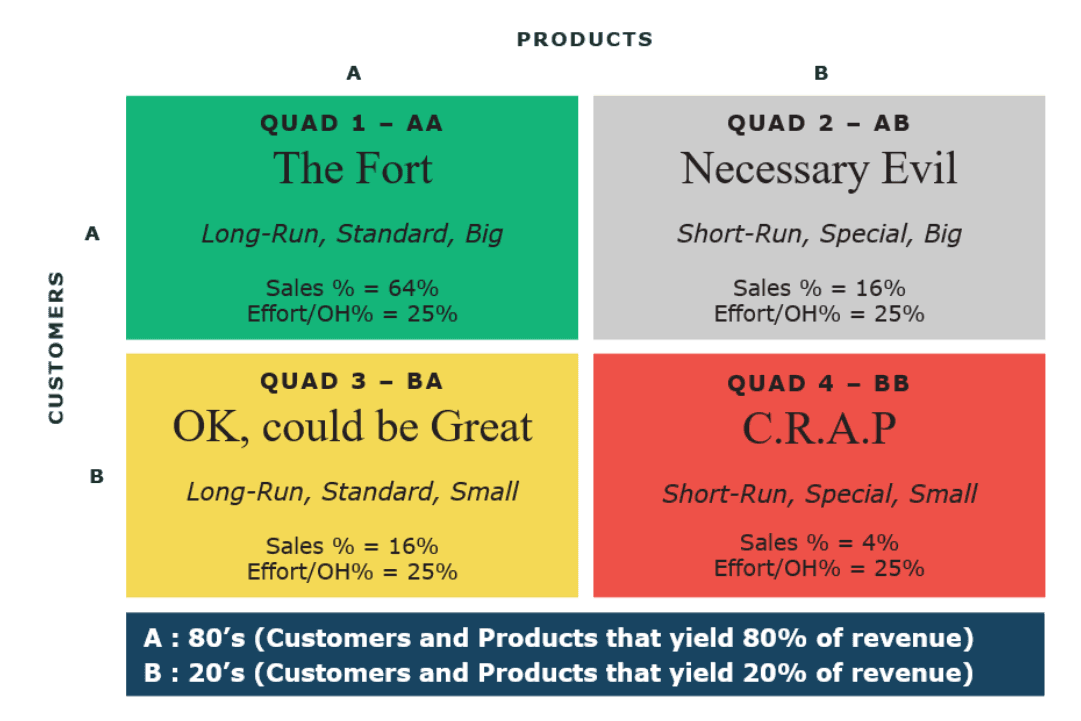
Quad 1: Hundreds of engagements have shown that top customers buying top products – will be 64% of your revenue. It’s why we call this quad “The Fort.” Companies must do whatever they can to protect the fort because often we find 150-200% of a company’s profit in this quad!
Quad 2: The quad we fondly call “The Necessary Evil” includes your top customers who buy “bottom-products.” This quad represents about 16% of your revenue and tends to be around break-even at the bottom line. This segment requires a lot of support without much revenue to cover it. Often this segment doesn’t boast good margins, either — your best customers tend to drive a hard bargain!
There are plenty of ways to minimize the losses here. You can raise prices — even on your biggest customers. There is risk, but you will only raise the prices on “B” products, and lower their prices on the “A” products/services they buy. Most likely, they buy more of your “A” products, so the deal is good for them, and good for you.
Quad 3: This quad is comprised of customers that aren’t necessarily the top customers, but they buy your “best” products. Sales here are also 16% because they are buying your “A” products. It’s OK, but it could be great, particularly if there’s potential to move this “B” customer into an “A” customer profile.
Policies should be put in place to standardize this business. We recommend treating this quad as “distribution.” It can either be sold to distributors or outsourced for fees, or this can be treated as a separate business within your business. Put policies in place to make these small customers profitable. For example, require minimums on orders with cash upfront (no credit checking, issuing POs, or invoicing), and no specialty service (without a price). Manage the overhead needed for these customers separately from the quad 1 and 2 businesses to ensure this quad is profitable.
Quad 4: Here is where you can’t realize a profit. There’s an acronym for that (C.R.A.P. — get it? "Can't Realize A Profit!"). This is where sales are 4% and you’re losing money serving low-value customers who are buying low-value products. If you put together a P&L focused on the resources needed for a quad 4 business, the results would show a very large loss of profit. Growth never comes from this segment, making it entirely non-strategic.
So, what do we do with a small, transaction-laden, overhead-needy, unprofitable, and completely non-strategic quad? 99.9% of the time, quad 4 and the overhead associated with it can be eliminated, allowing you to find the profit hidden in quad 1.
Without the time, energy, and resources used in quad 4, you could refocus your energy on quads 1 and 2 — which up until this point were lacking support. Just by eliminating quad 4, your company would immediately show financial improvement!
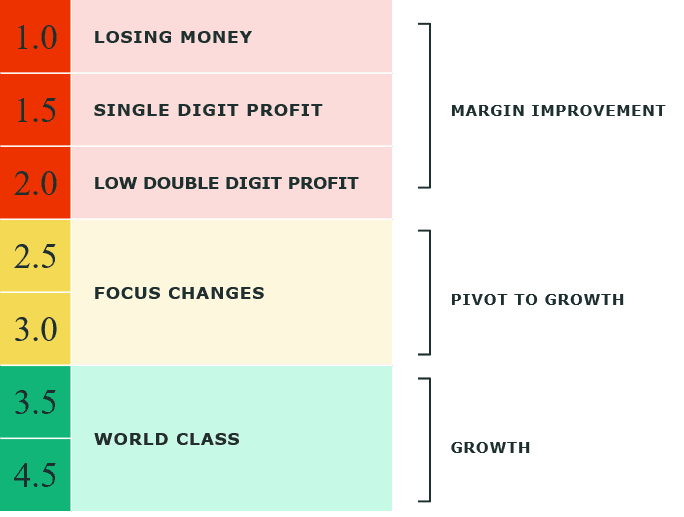
The Strategex Key Ratio™ helps our clients understand their business better and make marked improvements to their top and bottom-line performance. This data-reveal tool performs an analysis of your previous 16 quarters of financials. The Key Ratio is unique to Strategex’s toolkit of data tools, but it is one that you can run on your own company with a little effort. The Key Ratio is constructed by taking total material margin divided by total employee cost. It’s much more definitive than revenue per employee because it takes into consideration the profit that’s left.

The Strategex Key Ratio™ also tells an organization where to spend most of their time and efforts. If you have a low Key Ratio, focus on Margin Improvement (usually cost take out). The higher the Key Ratio, the more time should be spent on revenue growth.
Why care about data? Because data will tell you what to care about! Let it talk. You just have to be sure to listen to the data, and not your gut.
--
The author, Kay Cruse is Strategex's Vice President of Customer Experience.
To learn more about how Strategex can help your organization, schedule a call or introductory meeting today.
The information in this article is an introduction to 80/20. We encourage you to run your data, but please don't try to implement 80/20 alone. Trust us. It takes a couple of decades to become an 80/20 master. Top 80/20 CEOs turn to us for support for a reason. We're here to help whenever you're ready to make a transformation that yields explosive results.
Our guidance. Your growth.
Contact us to see how we can help your business today.
Never miss a beat. Get our latest insights in your inbox.